Candlestick patterns are one of the most effective tools for analyzing price action in forex trading. These patterns help traders understand market sentiment and predict potential price movements. Whether you are a beginner or an experienced trader, mastering candlestick patterns can significantly improve your ability to identify trade opportunities.
1. What Are Candlestick Patterns?
A candlestick represents a period of trading and consists of four main components:
- Open price – The price at the beginning of the trading period.
- Close price – The price at the end of the trading period.
- High price – The highest price reached during the period.
- Low price – The lowest price reached during the period.
Each candlestick forms a pattern that traders analyze to predict future price movements.
2. Common Candlestick Patterns
Bullish Candlestick Patterns (Indicating Upward Moves)
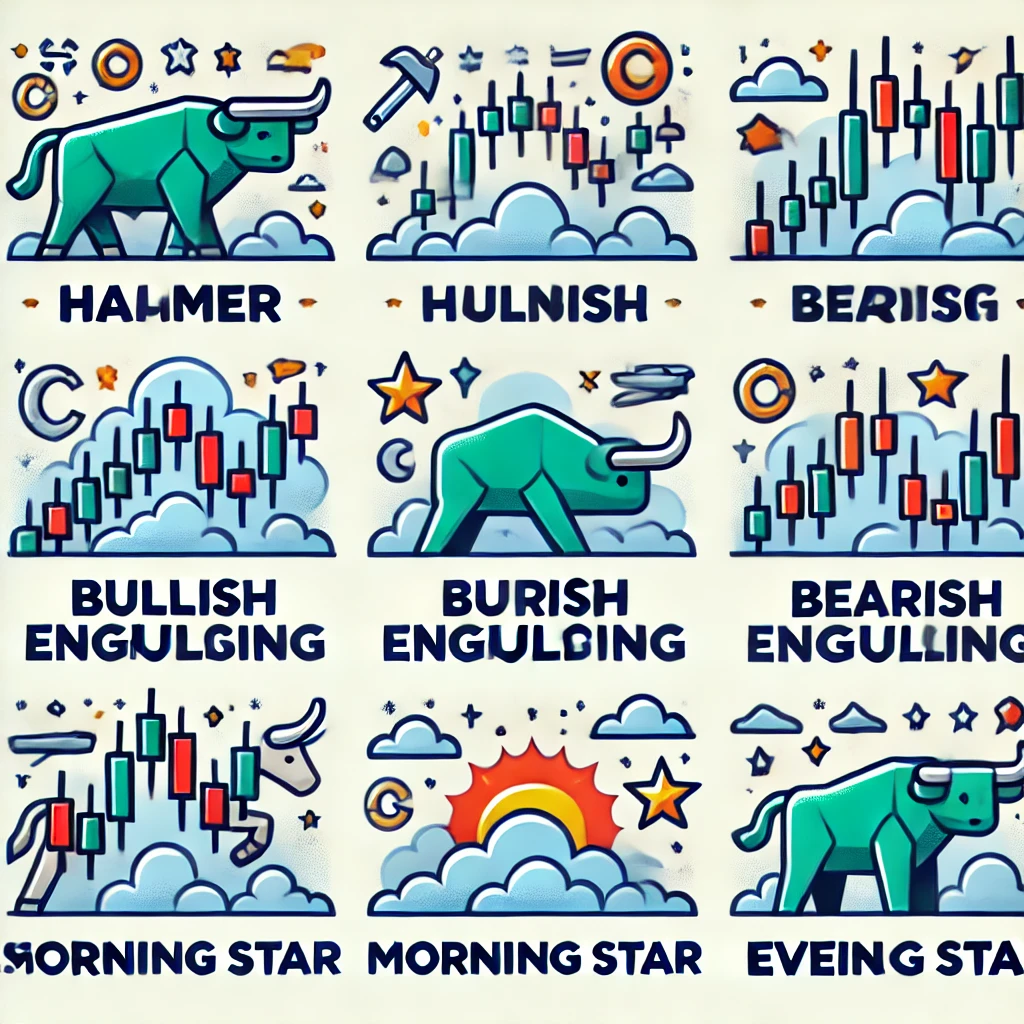
1. Hammer
- Appears at the bottom of a downtrend.
- Small body with a long lower wick.
- Signals a potential reversal to the upside.
2. Bullish Engulfing
- A small bearish candle is followed by a large bullish candle that engulfs it.
- Indicates strong buying momentum and potential price increase.
3. Morning Star
- A three-candle pattern: a bearish candle, a small indecisive candle, and a strong bullish candle.
- Suggests a potential reversal from a downtrend to an uptrend.
Bearish Candlestick Patterns (Indicating Downward Moves)
1. Shooting Star
- Appears at the top of an uptrend.
- Small body with a long upper wick.
- Suggests price rejection and potential reversal downward.
2. Bearish Engulfing
- A small bullish candle followed by a larger bearish candle that engulfs it.
- Indicates strong selling pressure and a possible price drop.
3. Evening Star
- A three-candle pattern: a bullish candle, a small indecisive candle, and a strong bearish candle.
- Signals a potential trend reversal to the downside.
3. How to Trade Using Candlestick Patterns
- Look for Confirmation – Always combine candlestick patterns with indicators like RSI, MACD, or Bollinger Bands for stronger trade signals.
- Identify the Trend – Candlestick patterns work best when analyzed within the context of an existing trend.
- Use Support and Resistance – Patterns near key support and resistance levels are more reliable.
- Set Stop-Loss Orders – Protect your trades by placing stop-losses beyond the high or low of the pattern.
4. Best Practices for Using Candlestick Patterns
- Be Patient – Not every pattern leads to a big move. Wait for confirmation before entering a trade.
- Avoid Overtrading – Don’t enter trades based on every pattern you see; look for the best opportunities.
- Use Multiple Timeframes – Check higher timeframes to ensure the candlestick pattern aligns with the overall trend.
Conclusion
Candlestick patterns provide powerful insights into market behavior and price movements. When combined with other technical tools, they can help traders make well-informed trading decisions.
Next, we will explore Using ATR (Average True Range) for Risk Management – an essential tool for setting stop-losses and managing trade risk effectively.