One of the most effective ways to improve trade accuracy is by using Multiple Time Frame (MTF) Analysis. This method helps traders see the bigger picture before making a trading decision. By analyzing multiple timeframes, traders can spot strong trends, confirm trade setups, and avoid false signals. In this guide, we’ll explore how to use multiple time frame analysis to enhance your forex trading strategy.
1. What is Multiple Time Frame Analysis?
MTF analysis involves analyzing the same currency pair across different timeframes to make better trading decisions. It helps traders:
- Identify the overall market trend.
- Spot high-probability trade setups.
- Avoid getting caught in short-term noise.
For example, a trader might use:
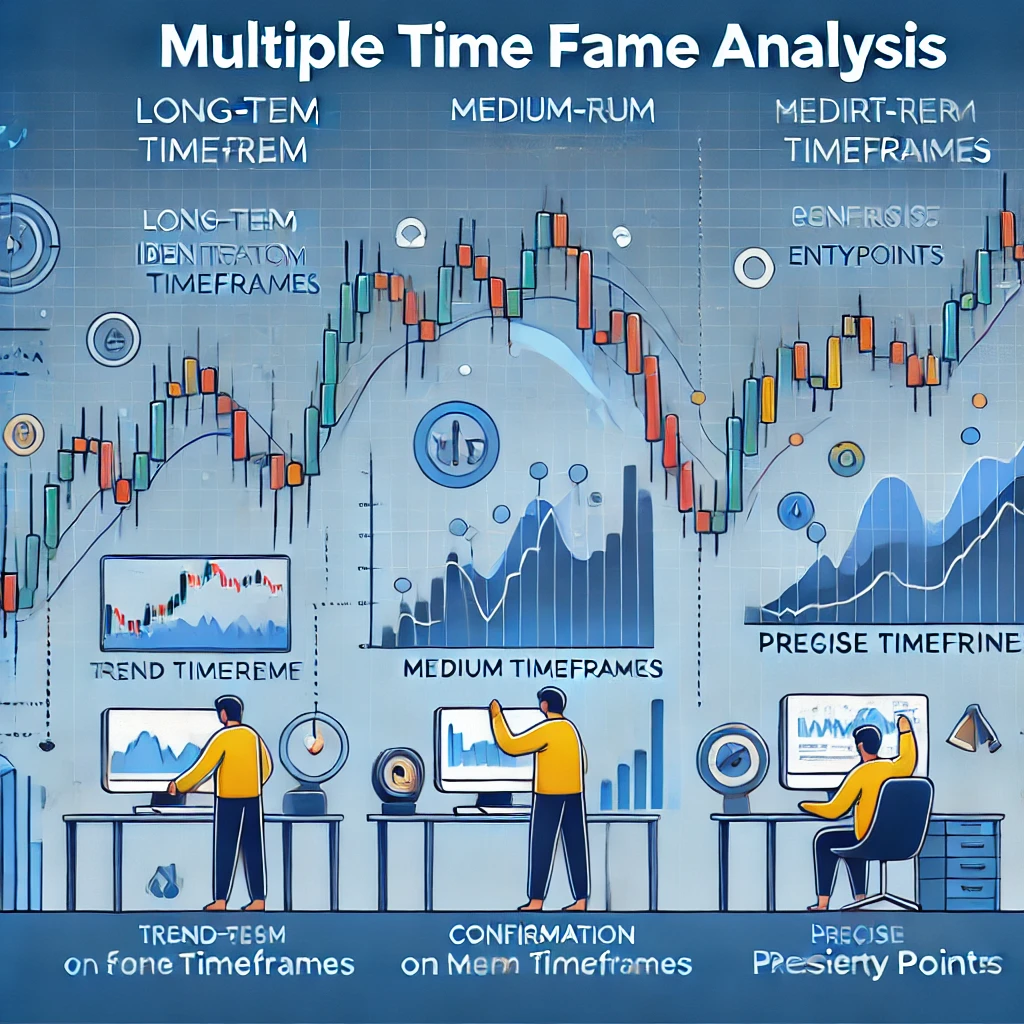
- Higher timeframes (Daily, 4-hour) – To determine the overall trend.
- Medium timeframes (1-hour, 30-minute) – To confirm trend direction.
- Lower timeframes (15-minute, 5-minute) – To pinpoint precise entry and exit points.
2. How to Use Multiple Time Frame Analysis
1. Choose Your Timeframes
Select three timeframes that complement each other:
- Long-Term (Trend Analysis) – Daily or 4-hour chart.
- Medium-Term (Confirmation) – 1-hour or 30-minute chart.
- Short-Term (Entry & Exit) – 15-minute or 5-minute chart.
2. Identify the Market Trend
Start with the highest timeframe to determine the main trend:
- If the price is making higher highs and higher lows, it’s an uptrend.
- If the price is making lower highs and lower lows, it’s a downtrend.
- If the price is moving sideways, the market is range-bound.
3. Look for Trade Setups on the Medium Timeframe
Once you identify the trend, move to the medium timeframe to look for confirmation signals.
- Check for pullbacks to key support/resistance levels.
- Use indicators like moving averages or RSI to confirm momentum.
4. Enter Trades on the Shortest Timeframe
Finally, use the lowest timeframe to fine-tune your entry and exit points.
- Look for candlestick patterns (e.g., pin bars, engulfing candles).
- Ensure the trade aligns with the trend seen on higher timeframes.
- Set stop-loss and take-profit levels based on support/resistance.
3. Example of a Multiple Time Frame Trade Setup
Step 1: Identify the Trend (Daily Chart)
- The price is in an uptrend with higher highs and higher lows.
Step 2: Confirm the Setup (1-Hour Chart)
- The price has retraced to a key support level and is showing bullish signals.
Step 3: Execute the Trade (15-Minute Chart)
- A bullish engulfing candle forms at the support level, confirming the entry.
- Stop-loss is placed below the support level, and take-profit is set at the next resistance.
Conclusion
Multiple Time Frame Analysis helps traders make better-informed decisions by looking at different perspectives of the same currency pair. By combining long-term trends with short-term trade entries, traders can increase their success rate and avoid false signals.
Next, we’ll explore Hedging in Forex: How to Reduce Your Risk – a strategy used by traders to protect their capital from market fluctuations.